Carbon Footprint Reduction for UK Packaging Buyers

A warehouse team is picking a 250g product into a 600x400x300mm carton, then feeding the empty space with paper because that's the box already on the pallet. A bakery may order printed window cartons for a seasonal range, only to discover that a sizeable share remains in storage after the promotion ends. Those decisions look operational, but they also lock in material, transport, storage and end-of-life impacts.
Carbon footprint reduction in packaging isn't achieved by choosing a green-looking substrate and stopping there. Material choice matters, but so do box dimensions, damage rates, returns, dispatch consolidation, supplier data and the reporting system behind every claim. UK buyers now need to judge those levers against carbon impact, cost and evidence, rather than recyclability alone.
Table of Contents
- Why Packaging Is a Carbon Hotspot for UK Businesses
- Build a Credible Packaging Carbon Baseline
- Material Choices and Their Real Carbon Trade-Offs
- Right-Sizing and Protective Design to Cut Returns
- Logistics Levers That Lower Dispatch Emissions
- Choosing UK Suppliers That Support Your Footprint Goals
- Reporting, EPR Compliance, and Your 90-Day Roadmap
Why Packaging Is a Carbon Hotspot for UK Businesses
Packaging creates emissions before it reaches the warehouse. Fibre passes through forestry, pulping, paper-making and corrugator operations. Plastic packaging depends on resin production and conversion, while aluminium requires energy-intensive primary conversion. Printed packaging also carries plate, ink and production impacts that can be wasted when forecasts are wrong.
The impact continues after dispatch. Packaging may be collected, sorted, reprocessed, rejected, incinerated or sent to landfill, depending on its material, format and local infrastructure. A recyclable pack doesn't automatically become a recycled pack, and a compostable pack doesn't automatically have a suitable collection route.
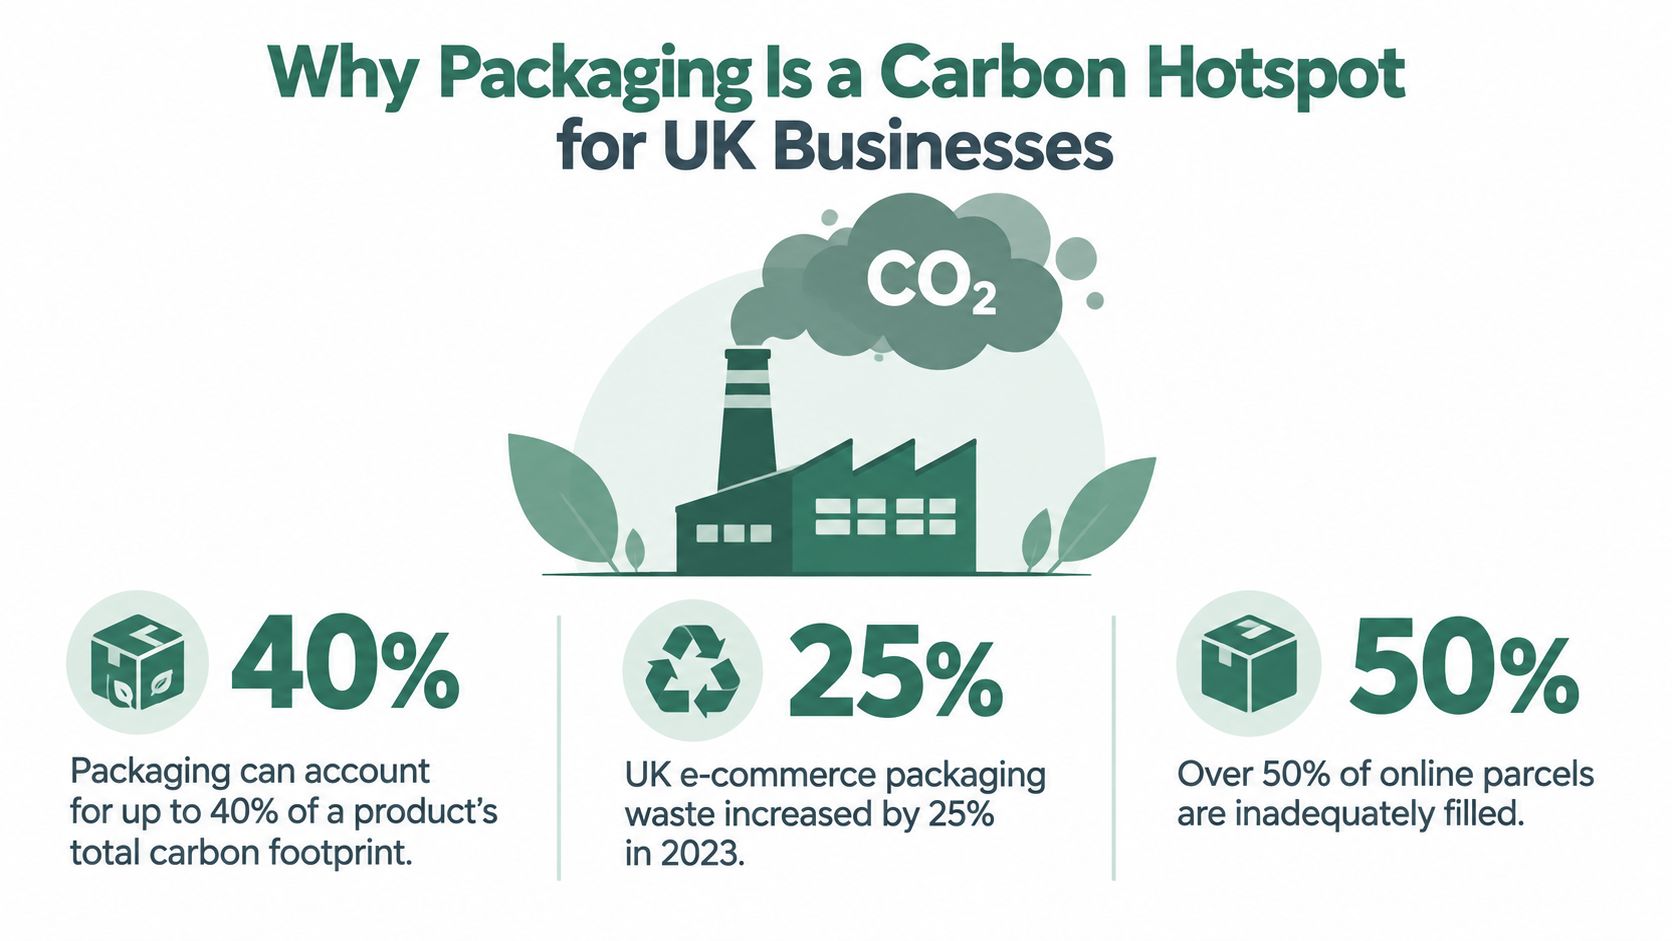
Practical rule: assess the packaging system from raw material to end of life. A lighter pack that causes breakages can create a worse result than a slightly heavier pack that protects the product first time.
The UK's consumption-based carbon footprint includes emissions from goods and services consumed by UK residents wherever they're produced. It was estimated at 699 MtCO2e in 2023, down 4% from 2022 and below the 2007 peak of 984 MtCO2e, according to the UK government's carbon footprint statistics. The per-person footprint was 10 tonnes CO2e in 2023, 5% lower than 2022 and 37% below the 2004 peak of 16 tonnes per person. That consumption view is important because packaging sits inside supply chains, not only inside a company's electricity bill.
UK territorial emissions were estimated at 413.7 MtCO2e in 2024, 50.4% below 1990 levels, in the Climate Change Committee's progress report. The country has made substantial progress, but packaging buyers still control a practical upstream lever. EPR reporting, recycling obligations and workplace collection changes are making poor records harder to defend, so the sensible approach is to build the evidence before a customer, auditor or regulator asks for it.
Build a Credible Packaging Carbon Baseline
A useful baseline starts with material flow, not a supplier brochure. London's packaging-footprint methodology recommends mapping material flows and supply-chain nodes, gathering relevant data, converting tonnages to CO2e, then testing reduction scenarios. Its documentation also highlights literature review and data-gap analysis because packaging results vary by category, material and supply-chain coverage. The London packaging footprint methodology is a sound model for UK buyers.
Create an inventory that reflects the warehouse
Pull procurement records for the last twelve months and list every packaging SKU. Record substrate, grammage, dimensions, unit weight, supplier, printed or plain status and the number purchased. Include corrugated cases, kraft mailers, glassine, PLA, rPET, LDPE bubble, tape, labels, transit wrap and void-fill.
Reconcile the list against invoices, goods-received notes and stock counts. That catches ghost stock, duplicated items and packaging that the procurement system records but the warehouse rarely uses. The baseline should also capture void-fill consumed per order, damage thresholds and returns, because a purchase-only view misses waste created during fulfilment.
A practical spreadsheet can use five tabs:
- SKU register: dimensions, substrate, unit weight and supplier.
- Material flows: purchased, used, returned to stock and discarded.
- Operational effects: order type, void-fill, damage and return reason.
- Emission factors: source, geography, allocation method and version.
- Actions: proposed change, owner, evidence, cost and review date.
Treat data quality as part of the result
Use recognised lifecycle inventory data for paper, board, plastic and aluminium, then document the assumptions. The London methodology notes that UK packaging LCAs are expected to use lifecycle inventory analysis, the cut-off allocation approach for end-of-life burdens and UK marginal-grid factors when calculating displaced electricity.
An LCA primer such as LCA explained for DPP compliance can help teams understand why boundaries and allocation choices affect comparisons. Supplier-declared carbon figures can be useful, but they shouldn't be accepted without checking system boundaries, recycled-content evidence and third-party verification.
Avoid false precision: don't count a recycled-content credit twice, don't omit transit packaging, and don't compare two supplier figures built on different boundaries.
For targets, a modest annual reduction can be more credible than a dramatic promise that requires immediate supplier churn. The baseline should show which changes are measurable, which assumptions remain weak and whether the proposed alternative protects the product at the same level. For example, Wholesale Hat Boxes may need to be assessed by board weight, finish and actual use rather than by appearance alone.
Material Choices and Their Real Carbon Trade-Offs
Material selection is where many carbon-footprint projects become too simplistic. Recyclability is valuable, but it isn't identical to a lower footprint. A material can be recyclable in principle yet difficult to collect, sort or reprocess in the format supplied.
The UK's 2025 to 2026 EPR base fees make the cost comparison tangible. Paper and card carry a base fee of £196 per tonne, plastic £423 per tonne, and aluminium £266 per tonne, as set out in the published EPR base fees. Those figures don't replace an LCA, but they do give buyers a direct reason to question unnecessary plastic, aluminium and excess weight.
| Substrate | CO2e (kg/kg) | Kerbside Recyclable | Recycled Content Range | EPR Fee Band |
|---|---|---|---|---|
| Virgin corrugate | Not stated in verified UK data | Generally, subject to local acceptance and contamination | Not stated | Paper and card, £196 per tonne |
| Recycled corrugate | Not stated in verified UK data | Generally, subject to local acceptance and contamination | Not stated | Paper and card, £196 per tonne |
| Kraft mailer with PE lining | Not stated in verified UK data | Format-dependent | Not stated | Fibre or plastic classification must be confirmed |
| Uncoated kraft mailer | Not stated in verified UK data | Generally more straightforward than a mixed laminate | Not stated | Paper and card, £196 per tonne |
| Glassine | Not stated in verified UK data | Dependent on local acceptance and specification | Not stated | Classification must be confirmed |
| PLA bread bag | Not stated in verified UK data | Not automatically accepted through UK kerbside systems | Not stated | Classification must be confirmed |
| rPET tray | Not stated in verified UK data | Format and local collection dependent | Not stated | Plastic, £423 per tonne |
| Virgin PET tray | Not stated in verified UK data | Format and local collection dependent | Not stated | Plastic, £423 per tonne |
| Corrugated honeycomb | Not stated in verified UK data | Fibre recycling route, subject to local acceptance | Not stated | Paper and card, £196 per tonne |
The practical default is a mono-material recyclable substrate, sized to protect the product, with recycled content where supply and quality are stable. A paper pack with a plastic lining may perform well in use but can create a more complicated recycling decision. A compostable claim needs appropriate certification and a realistic collection route, not just a bio-based feedstock.
Greenwash often appears in three forms: compostable language without EN 13432 evidence, recycled-content claims without chain of custody, and bioplastic layers that contaminate paper recycling streams. The guide to eco-friendly packaging is useful background, but the buying decision still needs SKU-level evidence.
UK-funded packaging innovation projects are expected to deliver more than 1.5 million tonnes of CO2 savings between 2025 and 2030, according to the Smart Sustainable Plastic Packaging Challenge report. That opportunity won't come from swapping every pack blindly. It depends on matching material, performance and end-of-life route.
Right-Sizing and Protective Design to Cut Returns
A small box is not automatically a better box. If the pack crushes, splits or allows the product to move, the business pays for replacement stock, another pick, another parcel and another customer-service interaction. Damage prevention belongs inside carbon-footprint reduction because the original packaging isn't the whole shipment.
Start by measuring the empty space in current cartons. Record the product dimensions, internal box dimensions and the void-fill used for each major order profile. A target of under 15% void space can be used as an operational design ambition, but it must be tested against drop, compression and handling conditions rather than treated as a universal rule.
Design around real order patterns
Warehouse data often shows that a long list of standard boxes serves only a small number of repeat combinations. A tighter range of sizes, tied to order profiles, can reduce picking errors and make replenishment easier. The right number of sizes depends on the product mix, so the useful exercise is to compare the current range with the orders it fulfils.
For fragile goods, use a corrugated insert rather than filling the whole carton with loose material. Corrugated pads can separate tins, while crumpled kraft can stabilise products without the recovery problems associated with some air pillows. Bakery dispatches need particular care around crushing, moisture and presentation. An appropriately sized mailer can remove layers of unnecessary board, but only after a transit trial.
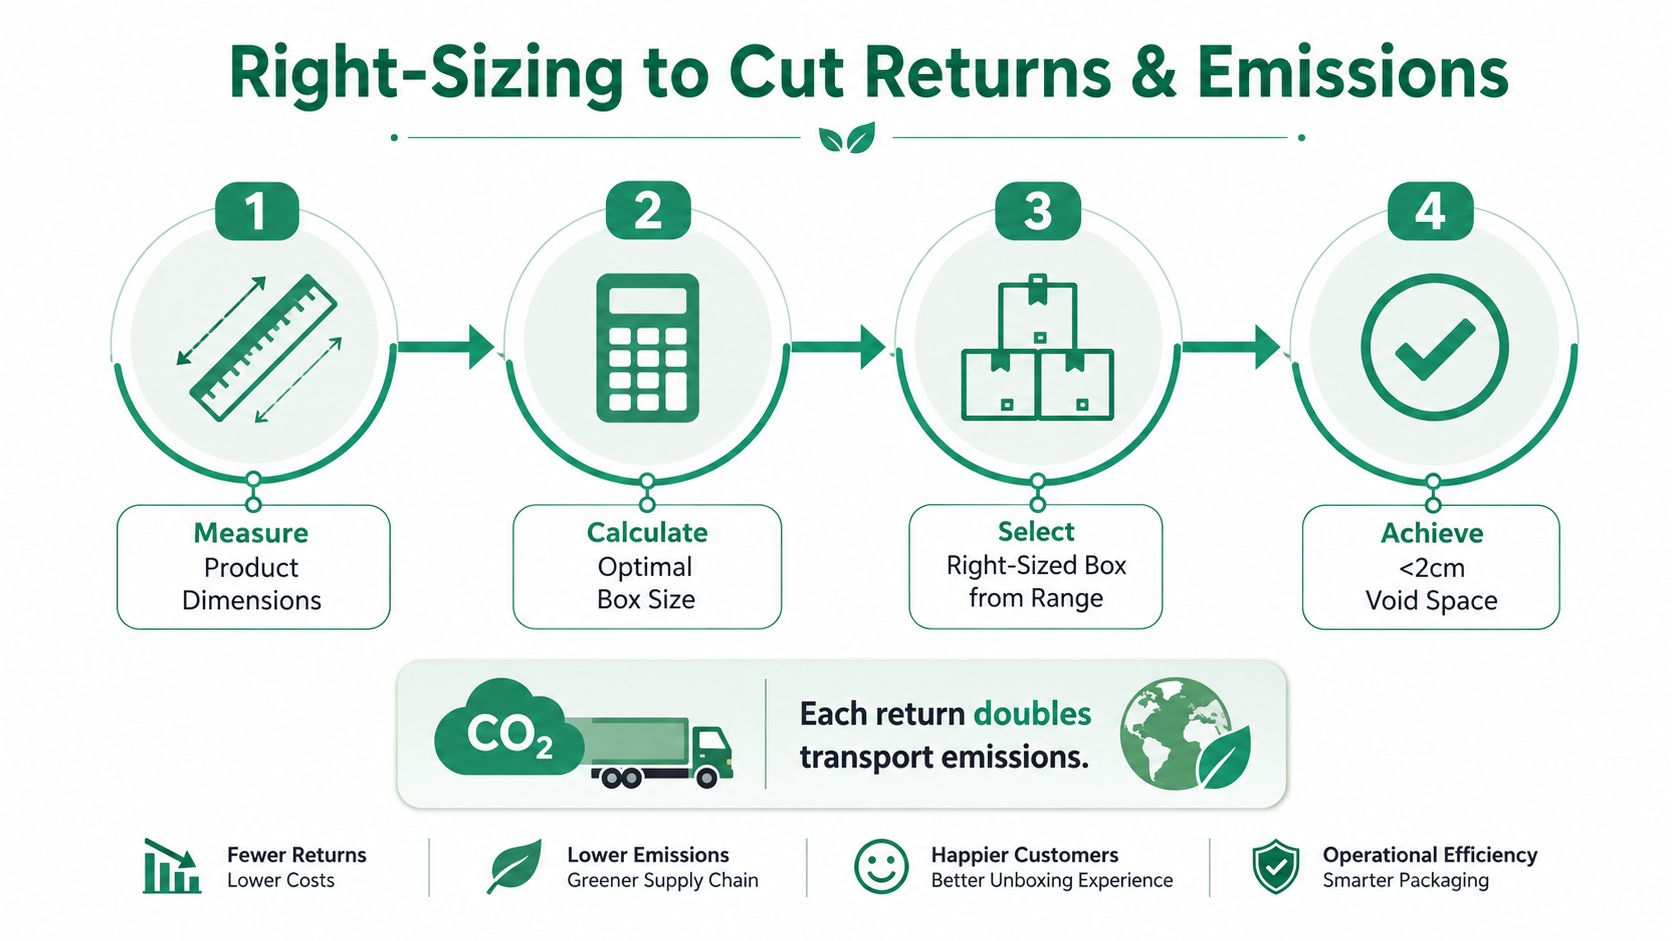
A 380x280x80mm bakery mailer may replace two larger boxes and a pre-fill sheet for ambient biscuits where the product dimensions and protection requirements allow it. The relevant result is not the box size on its own. It's the measured material weight, packing time, damage outcome and return outcome after the change.
The guide to measuring boxes can help standardise internal and external dimensions before supplier conversations. Every trial should record product condition on arrival, not just whether the carton looked neat.
Smaller, lighter packaging also reduces the tonnage reported for EPR, although classification and fee treatment still need to be confirmed. Right-sizing therefore links carbon, fulfilment efficiency and compliance, provided the design doesn't trade away product protection.
Logistics Levers That Lower Dispatch Emissions
Logistics reductions usually come from several ordinary operating decisions rather than one dramatic carrier switch. Consolidating orders, choosing the appropriate service level and positioning stock closer to demand can all reduce unnecessary movement.
The first question is whether a multi-line order is being split into several single-item dispatches. If stock is available in one location, a consolidated carton may remove duplicate packaging and extra handling. Cut-off rules matter too. A warehouse that releases every order immediately may send parcels separately when a short holding window could combine them without damaging the customer promise.
Audit the carrier mix
Carrier selection should follow product and service requirements. Fragile goods, chilled bakery products and non-fragile ambient items shouldn't be forced into the same network because one rate card looks convenient.
| Carrier tier | Max parcel size / weight | Typical use case | Indicative CO2e per parcel |
|---|---|---|---|
| Economy network | Confirm with carrier | Non-fragile ambient goods where delivery speed is flexible | Obtain carrier-specific figure |
| Tracked postal service | Confirm with carrier | Smaller bakery or e-commerce parcels within the service limit | Obtain carrier-specific figure |
| Dedicated courier | Confirm with carrier | Chilled, fragile or time-sensitive consignments | Obtain route-specific figure |
The table is deliberately evidence-led. Carrier emissions vary by route, vehicle, service, consolidation and calculation boundary, so a generic figure can mislead. Buyers should ask each carrier for the methodology, reporting period and whether the figure covers depot handling, failed delivery and return movement.
A transport-management system can expose missed cut-offs, partial loads, repeated delivery attempts and avoidable waiting. For background on how software can address operational friction, see haulage management software cuts delays. The useful output isn't a sustainability dashboard by itself. It's a list of dispatch decisions that the warehouse can change.
Fulfilment geography deserves the same scrutiny. A Midlands 3PL may suit routes to Scotland and Northern Ireland differently from a South East operation, but the answer depends on customer density, inventory placement and carrier network design. Model the actual order file before moving stock. A shorter average route can be cancelled out by split stock, emergency replenishment or extra inter-site transfers.
Choosing UK Suppliers That Support Your Footprint Goals
A packaging supplier's usefulness is revealed in the questions it can answer, not in the colour of its sustainability brochure. Buyers need enough detail to compare a plain stock item with a printed alternative, a lighter board with a heavier protective grade and a domestic delivery with an imported replenishment.
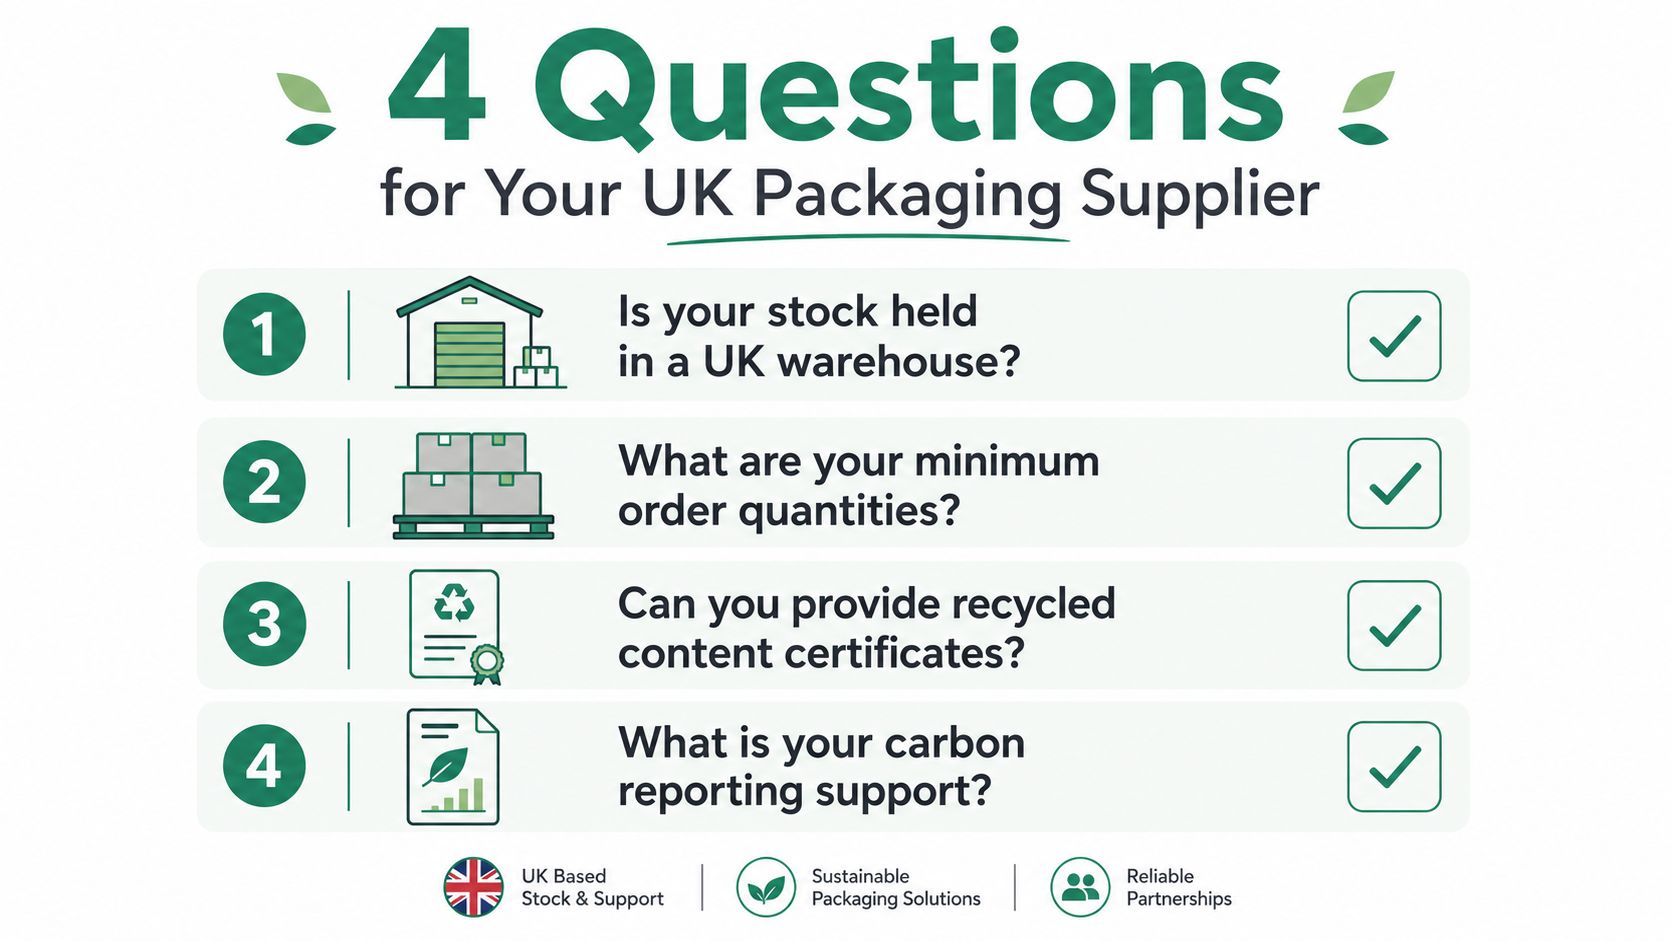
Four questions should be answered before a contract or recurring order is agreed:
- Where is stock held? A UK warehouse, imported container stock and made-to-order production create different lead-time and replenishment risks.
- What are the minimum order quantities? Printed runs can leave a business with obsolete packaging after a product, campaign or brand treatment changes.
- What is the plain-stock lead time? A short replenishment route can prevent emergency buying of an unsuitable substitute.
- What evidence supports the material claim? Ask for recycled-content certificates, chain-of-custody documentation and a carbon statement per SKU where available.
The supplier should be able to quote the weight of one finished unit. If the answer is only “lightweight” or “eco”, the buyer can't build a credible material baseline. Suppliers should also explain whether mixed pallets are possible, how printed waste is handled and which data fields appear on invoices and delivery notes.
Supplier test: request the same specification from several suppliers. The clearest answer usually comes from the business that understands weight, material composition, lead time and reporting as one package.
Red flags include an inability to provide per-gram weights, refusal to discuss mixed pallets and minimum printed runs that don't match realistic demand. A supplier scorecard can keep the decision objective:
- UK stockholding: location, replenishment and delivery evidence.
- Bespoke capability: sizes, shapes, print process and realistic minimum runs.
- Volume pricing: transparent breaks, freight treatment and no unexplained add-ons.
- EPR-ready records: material category, weight, recycled content and reporting support.
A scalable sustainable supply chain approach is most useful when it turns supplier information into repeatable purchasing data. Packaging Panda, for example, supplies recyclable and compostable packaging, mailing and protective products, alongside made-to-order packaging with minimum runs from 500 units. The buyer still needs to validate the specific product specification and evidence for the intended use.
Reporting, EPR Compliance, and Your 90-Day Roadmap
Carbon reduction becomes credible when the business can reproduce the calculation. UK packaging reporting already provides a useful discipline. Under the packaging waste reporting framework, large producers report packaging data every 6 months, while small producers report annually, with submissions validated through the National Packaging Waste Database. The packaging data reporting-period guidance sets out the relevant cadence and deadlines.
The internal operating rhythm should be more frequent than the legal submission. Quarterly capture of tonnage by packaging category gives finance, procurement and warehouse teams time to resolve missing weights before the annual EPR submission. It also creates a reliable trail for larger sellers preparing Scope 3 disclosures or responding to customer questionnaires.
Put carbon and EPR cost in the same decision
The EPR base-fee structure gives procurement a financial lens alongside the carbon baseline. For 2025 to 2026, the published base fee is £196 per tonne for paper and card, £423 per tonne for plastic and £266 per tonne for aluminium. Fee classification depends on the packaging and the applicable rules, so no buyer should assume that a mixed format belongs in the cheapest band.
Recycling obligations are tightening. For paper, board or fibre-based composite material, the business targets are 75% in 2025, 77% in 2026 and 79% in 2027. Plastic targets are 55% in 2025, 57% in 2026 and 59% in 2027, according to the UK packaging recycling obligation guidance. That makes consistent material and weight records more valuable than a one-off packaging redesign.
The government reports 64.1% of UK packaging waste recycled under methodology 1 in 2024, and 75.2% under methodology 2, based on 12,727 thousand tonnes placed into the recycling calculation and 8,154 thousand tonnes recycled, as explained in the UK statistics on waste. The differing methodologies reinforce the need to record which basis a comparison uses.
Use a 90-day implementation plan
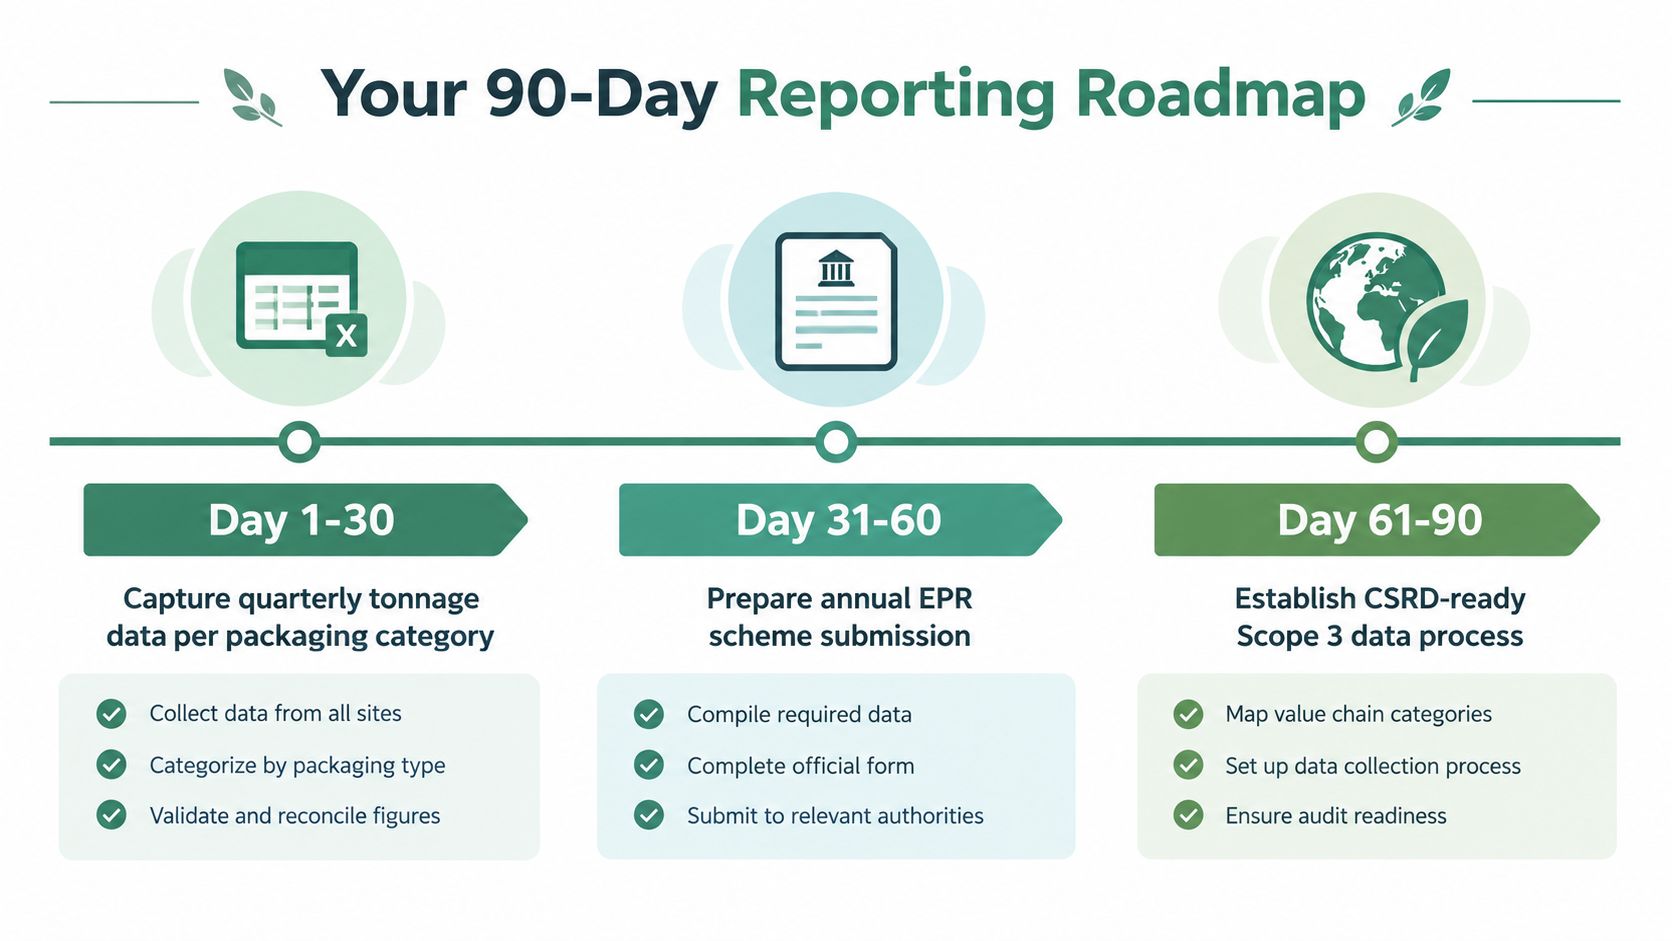
- Days 1 to 30, capture: build the SKU register, weigh representative units, reconcile procurement with warehouse records and separate packaging categories.
- Days 31 to 60, design: issue supplier briefs for right-sizing and material swaps, collect evidence, review carrier data and identify products where protection is currently excessive or insufficient.
- Days 61 to 90, lock: confirm EPR responsibilities, standardise the reporting template, select a pilot range and document the pre-change baseline and post-change measures.
Simpler Recycling adds another operational reason to improve capture. Workplace requirements began in March 2025, while households are due to follow in March 2026, according to the government announcement on improved local recycling services. Packaging specifications should therefore reflect the collection routes available to the intended user, not an assumed national system.
Quick wins can include replacing unsuitable loose void-fill with corrugated shred where protection trials support it, removing plastic tape where a recyclable sealing alternative performs adequately and consolidating box SKUs within each size family. The extended producer responsibility guide provides useful UK context, but the implementation still belongs with named owners in procurement, operations and finance.
Packaging Panda supplies recyclable and compostable packaging, mailing products, protective lines, boxes and bakery packaging for UK businesses, with made-to-order options available for bespoke sizes and printed formats. Visit Packaging Panda to compare packaging options and start a supplier conversation based on weight, protection, material evidence and EPR-ready records.